AI Developer Productivity: DORA, SPACE & the Perception Gap
Developers feel faster with AI; the studies disagree. How to measure AI developer productivity honestly with telemetry, DORA, SPACE and real experiments.
In July 2025, METR published the most uncomfortable chart in our industry. Sixteen experienced open-source developers worked on 246 real issues in repositories they knew well, each issue randomly assigned to "AI allowed" or "AI not allowed". Before the study they expected AI to cut their completion time by 24%. Afterwards they believed it had cut it by 20%. The stopwatch said the opposite: with AI, tasks took 19% longer. Economists and machine-learning experts asked to forecast the result had predicted a speed-up of 38–39%.
Sixteen months later, most enterprises have rolled out AI coding assistants and agents anyway. Budgets for 2027 are being set now, and someone has to answer the CFO's question: what did we get for it? This article is for the people who have to answer it honestly: CTOs, engineering directors, platform leads and the architects asked to "build a dashboard". We lay out a four-layer measurement stack, show what the published evidence actually says, and explain how to run the measurement in a European company without breaching labour law.
TL;DR / Key takeaways
- Feeling faster is not being faster. In METR's 2025 trial developers believed AI made them 20% faster while it made them 19% slower. In GitHub's 2022 trial they underestimated a 55.8% gain. Self-report is a signal, not a stopwatch.
- The evidence is genuinely mixed. Controlled studies range from 19% slower to 55.8% faster. The context decides: task type, codebase size, developer familiarity and tool generation.
- Adoption telemetry is not productivity. Acceptance rates, tokens and AI-authored PRs tell you people use the tools. They say nothing about whether value reaches customers sooner.
- Measure four layers, then run an experiment. Telemetry, DORA delivery metrics, SPACE experience measures and business outcomes, tied together by a staggered rollout with a control group.
- In Germany, measurement is co-determined. Telemetry that can show individual performance falls under section 87(1) no. 6 BetrVG. Design for team-level aggregation from day one.

Download: Editable draw.io file · Open in diagrams.net · Chart data (CSV)
Why this argument matters now
Adoption is no longer the question. Google's 2025 DORA report, based on nearly 5,000 technology professionals, puts AI adoption at 90%, a 14% increase on the previous year, with a median of two hours of use per day. In Stack Overflow's 2026 survey, 73% use coding assistants and agents every day. The tools are in; the licences are renewing.
What is missing is evidence that the organisation is better off. DORA's 2025 report found that more than 80% of respondents say AI has enhanced their productivity. It also found that AI adoption is now linked to higher delivery throughput, reversing the 2024 finding, but still to higher delivery instability. A year earlier, DORA had estimated that as AI adoption increased, delivery throughput fell by 1.5% and delivery stability by 7.2%. Both reports tell the same story from different angles: individuals feel faster, but the system does not automatically ship better software.
Meanwhile the shape of AI use has changed. In 2025 most developers used autocomplete and chat; by late 2026 many teams run coding agents that open pull requests on their own. That breaks the old metrics twice. Activity metrics explode, because an agent can produce more commits in an afternoon than a team used to in a week. And time tracking stops working: METR reported in February 2026 that it could no longer reliably record time for developers who ran several agents in parallel. If your measurement plan still counts lines of code or "hours saved" from a survey, it was out of date before it shipped.
There is a further reason to get this right in 2027: productivity numbers feed headcount decisions. If the figure behind a hiring freeze came from a vendor dashboard or a self-report survey, the organisation is making an expensive decision on bad evidence. We have argued before that the developer shortage in Germany will not be solved by AI alone.
The measurement stack, layer by layer
Read the diagram bottom-up. Each layer answers a different question and misleads in its own way. Heading numbers match the callouts.
① AI tool telemetry: adoption, not productivity
The bottom layer is what the vendors give you for free: active users, days of use, suggestion acceptance rate, chat and agent sessions, AI-authored pull requests, tokens and spend. Every major assistant exposes some version of it through admin dashboards or APIs.
This layer answers one question well: are people using what we bought? An unused licence is pure cost, and a team that tried the tool and stopped is telling you about fit.
It answers nothing about productivity. Acceptance rate is the classic trap: a suggestion that is accepted and then rewritten, or that causes a bug next month, still counts as a win. Token consumption is worse. It measures machine effort, and it rises when agents loop, retry or wander. DORA has even published an insight titled "Finding balance in the era of tokenmaxxing". The rule we use: telemetry goes on an adoption dashboard, labelled as such, and never appears on a slide titled "productivity".
Telemetry still has one critical job: it tells you who had the treatment. Without it you cannot separate heavy users from licence holders who never open the tool, and every comparison above becomes mush.
② Software delivery: DORA's five metrics
The second layer asks whether more change reaches production, and whether it does so safely. DORA's current guidance defines five software delivery metrics in two groups:
- Throughput: change lead time (commit to running in production), deployment frequency, and failed deployment recovery time.
- Instability: change fail rate (deployments that need urgent follow-up such as a rollback or hotfix), and deployment rework rate (unplanned deployments triggered by a production incident).
They suit AI measurement for three reasons. They are system-level, so they capture the review and integration bottlenecks that individual speed-ups push work into. They include a quality counterweight, so "faster" cannot win by quietly shipping defects. And any organisation with a CI/CD pipeline can compute them from data it already has.
They have limits. They are lagging and noisy, so a four-week pilot rarely moves them convincingly. They miss work that never reaches a deployment, and they are easy to game once they become targets. Use them as a trend, compared between groups, not as a scoreboard. DORA's own 2025 AI Capabilities Model names seven practices that amplify AI's benefits, including small batches, strong version control and quality internal platforms. If your delivery data lives in a dozen tools, this is also where a decent internal developer platform pays for itself: one pipeline, one event stream, one set of definitions.
③ Developer experience: SPACE and the survey you must run
The third layer asks how the work feels and where it flows. The SPACE framework, published by Nicole Forsgren, Margaret-Anne Storey and colleagues in ACM Queue in 2021, names five dimensions: Satisfaction and well-being, Performance, Activity, Communication and collaboration, and Efficiency and flow. Its central argument is that productivity cannot be captured by one metric, and that you should measure across several dimensions, mixing system data with what people tell you.
For AI, this layer is where you catch the effects the delivery metrics hide. Are reviewers drowning in larger pull requests? Do developers feel they understand the code they now own? Has interrupted time gone up because agents need supervision? Atlassian's 2025 developer experience survey of 3,500 developers and managers found that 68% save more than 10 hours a week with AI, but 50% lose 10 hours or more a week to non-coding friction. That is a SPACE finding: the time AI saves is easily absorbed elsewhere.
Run a short survey, quarterly at most, with the same questions every time, and include one question about perceived speed. It does not measure speed, but the gap between perceived and measured speed is one of the most useful numbers you will produce, and, as we show below, it can be large in either direction.
④ Business outcomes: what the organisation actually buys
The top layer is the one boards care about and engineering dashboards usually skip: lead time from idea to customer value, cost per delivered change, customer-facing incidents, roadmap items delivered per quarter. They are slow and shaped by much more than AI. That is why they matter. If two quarters of faster coding produce no change in time to value, the bottleneck is not in the code.
Faros AI's 2025 telemetry study of more than 10,000 developers across 1,255 teams makes the point bluntly. Teams with high AI adoption completed 21% more tasks and merged 98% more pull requests, yet the study found no significant correlation between AI adoption and improvements at company level. The gains were real locally and evaporated in aggregate. If your measurement stops at layer ② or below, you will never see that.
Connect this layer to money where you can. Our approach to quantifying technical debt in euros works for AI too: express the result as cost per change or delay cost avoided, not as "developer hours saved".
⑤ The causal layer: experiments, not dashboards
A dashboard can show that teams using AI ship faster. It cannot show that AI is the reason. Strong teams adopt new tools first, and greenfield teams see bigger gains. Without a comparison group you are measuring enthusiasm and context, not effect.
Every credible number in this article comes from a randomised design: METR randomised tasks, GitHub and the field experiments randomised developers. You can do the same inside an enterprise with modest effort:
- Staggered rollout. Enable teams in waves, assigned at random. Until a team gets access, it is the control group. Nobody loses a tool they already had, and in 12–16 weeks you have a clean comparison.
- Hold-out group. Keep a small, randomly chosen set of teams on the previous tool generation for one quarter when you upgrade, for example from autocomplete to agents.
- Pre-registration. Write down the metrics, the comparison and the decision rule before you start. This is the single cheapest way to avoid fooling yourself.
The METR follow-up is a useful warning about how fragile this is. In its second study, which started in August 2025 with 57 developers, recruitment got harder because more developers did not want to work without AI, and 30–50% of those surveyed said they had held back some tasks for the same reason. METR concluded that its new data was "an unreliable signal". Inside a company you have the advantage of an ongoing rollout: you are not asking anyone to give AI up, only to wait for their wave.
⑥ The guardrail: aggregate per team, never rank individuals
The dashed green boundary is not decoration. Every layer can be computed per person, and the moment it is, people optimise the metric instead of the work, the data becomes performance surveillance, and in Germany you need the works council's agreement for something you have already built.
DORA's metrics describe teams and the services they deliver, not individuals, and EU law points the same way (see the governance section). Our standard design aggregates at team level with a minimum group size, keeps raw identifiers out of the analytics store, and writes the purpose into the data model. It costs almost nothing up front. Retrofitting it costs months.
What the numbers say
We collected the published studies that measured AI's effect on developer speed against a control group, and added developers' own estimates where a study recorded them. The chart uses those papers alone. We ran no benchmark of our own; our contribution is the comparison and the method.
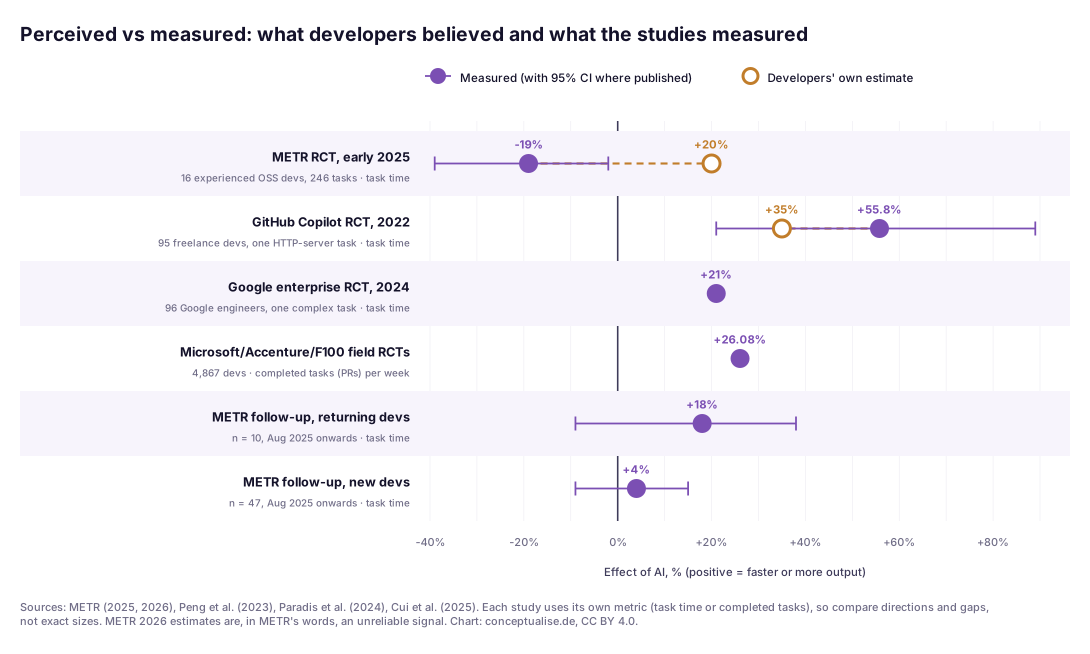
Three readings stand out.
First, the spread is enormous, and it is not noise. The 55.8% result comes from 95 freelance developers implementing an HTTP server in JavaScript from scratch in 2022. The minus 19% result comes from 16 developers with years of contributions to repositories averaging more than 22,000 stars and over a million lines of code, using Cursor Pro with Claude 3.5 and 3.7 Sonnet in early 2025. Google's internal trial with 96 engineers on a complex enterprise-grade task landed around 21%, with a wide interval. The field experiments across 4,867 developers at Microsoft, Accenture and a Fortune 100 company found 26.08% more completed tasks per week, with larger gains for less experienced developers. Greenfield, small and unfamiliar favours AI. Large, mature and deeply familiar did not, at least with early-2025 tools.
Second, the perception gap runs in both directions. METR's developers overestimated their speed by roughly 40 percentage points; GitHub's participants underestimated theirs by about 20. People are poor judges of their own speed with a new tool, either way. A survey asking "how much time does AI save you?" produces a feeling, and nobody should plan headcount on a feeling.
Third, the newest data is the least certain. METR's 2026 follow-up estimates an 18% reduction in task time for the ten returning developers and 4% for the 47 new ones. Both confidence intervals include zero, and METR itself calls the estimate "a bad proxy" because of selection effects. METR also thinks developers are probably more sped up now than in early 2025, and we agree. That is exactly why you need your own measurement rather than borrowed numbers.
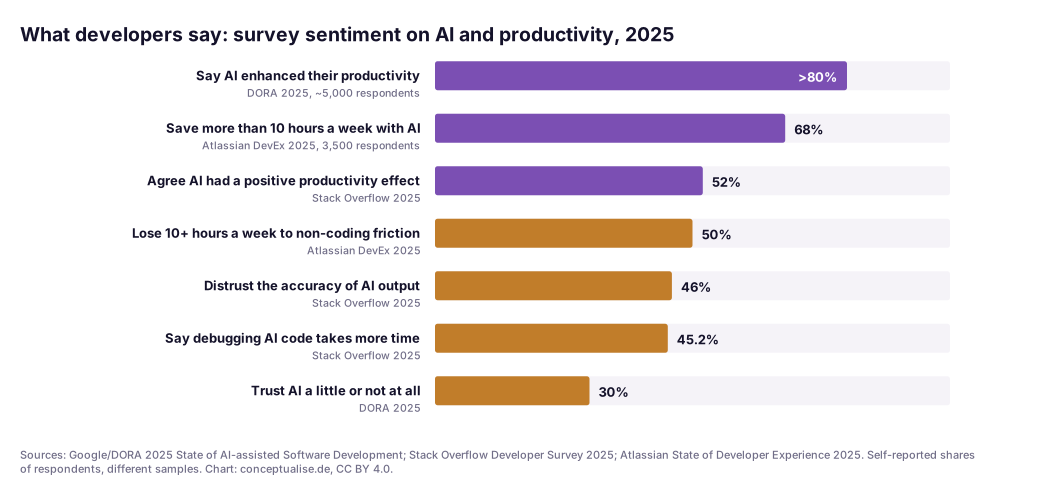
Surveys tell a consistent story of high use, high perceived benefit and low trust. Over 80% of DORA's respondents say AI enhanced their productivity. In Stack Overflow's 2025 survey, 52% report a positive productivity effect, yet 46% distrust the accuracy of AI output, 66% are frustrated by solutions that are "almost right, but not quite", and 45.2% say debugging AI-generated code takes more time. Favourable sentiment fell to 60%, from over 70% in 2023 and 2024. None of this measures speed. It describes a workforce that likes the tools and does not quite trust them, which is exactly where perception and measurement come apart.
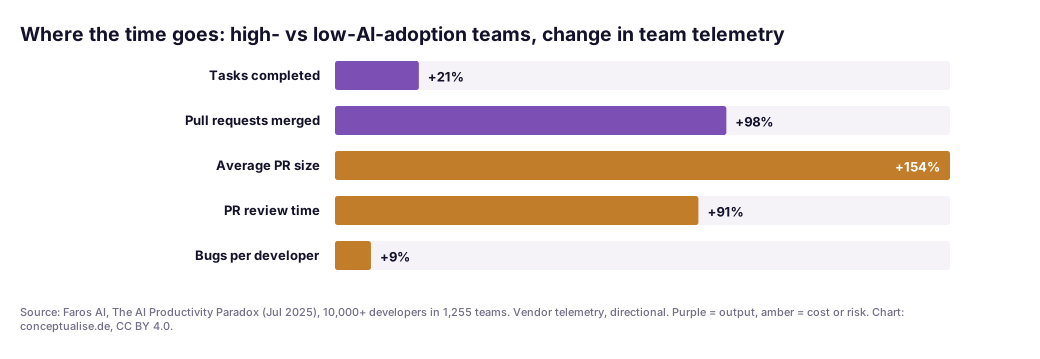
The third chart shows where the time goes. In Faros AI's telemetry, output rose: 21% more tasks completed, 98% more pull requests merged. But average PR size rose 154%, review time per PR rose 91% and bugs per developer rose 9%. Treat these as directional, since this is vendor data from a company that sells engineering analytics. The pattern matches what we see in practice: AI moves the bottleneck from writing code to reviewing it. GitClear's analysis of 211 million changed lines points the same way from the code side. Between 2021 and 2024 the share of cloned lines rose from 8.3% to 12.3%, while the share of lines associated with refactoring fell from 25% to under 10%.
One more data point is not about speed at all. In January 2026 Anthropic published a randomised trial with 52 mostly junior engineers learning an unfamiliar Python library, Trio. The AI group finished about two minutes faster, which was not statistically significant, but scored 50% on a follow-up quiz against 67% for the group that coded by hand. Without a skills dimension, you will not see that cost for years.
In a recent engagement…
This year we helped a mid-sized European software company prepare its 2027 budget for AI development tools. The engineering leadership had a dashboard from their assistant vendor showing high weekly active use, a healthy acceptance rate and an estimate of "hours saved" derived from accepted suggestions. Finance had heard the hours-saved figure and wanted to know why the hiring plan had not changed.
We did not argue with the dashboard. We added the layers above it. Pipeline data showed change lead time essentially flat over the two quarters since rollout, with pull requests getting noticeably larger. A short SPACE-style survey showed developers feeling faster and reviewers feeling overwhelmed: senior engineers spent a growing share of their week reviewing changes they had not written and did not fully trust. The constraint had moved from authoring to review, and review capacity had not changed.
The fix was mostly organisational. The company introduced a size limit and a structured description for AI-assisted pull requests, automated the routine checks that had landed on senior reviewers, and planned the next upgrade, from assistant to agent, as a staggered rollout in three waves. The hours-saved figure left the board pack. Lead time, change fail rate and review load replaced it, compared between enabled and not-yet-enabled teams. The works council approved the design quickly, largely because team-level aggregation was built in from the start.
The decision table: which question, which metric
This is the screenshot-able part. Start from the question someone is actually asking, and pick the layer that can answer it.
| Question being asked | Layer | Metrics that answer it | Metrics that do not | Typical trap |
|---|---|---|---|---|
| Are people using what we bought? | ① Telemetry | Active users, usage days, sessions per user, licence utilisation | Acceptance rate as "speed-up" | Treating use as value |
| Does more change reach production? | ② DORA throughput | Change lead time, deployment frequency, failed deployment recovery time | Commits, PR count, lines of code | Agents inflate activity |
| Are we shipping more defects? | ② DORA instability | Change fail rate, deployment rework rate, escaped defects | "Bugs found by AI review" | Speed paid for with rework |
| Where has the bottleneck moved? | ② + ③ | Review time per PR, PR size, time in review queue, interrupted time | Individual cycle time | Seniors absorb the review load |
| How does the work feel? | ③ SPACE | Quarterly survey: satisfaction, flow, cognitive load, perceived speed | One-off "hours saved" poll | Mistaking perception for measurement |
| Are developers still learning? | ③ SPACE | Onboarding time, ownership confidence, skills checks for juniors | Output of juniors alone | Short-term speed, long-term skills debt |
| Did the business get more? | ④ Outcomes | Time to customer value, cost per change, roadmap delivery, incidents | Hours saved × hourly rate | Local gains vanish in aggregate |
| Did AI cause the change? | ⑤ Experiment | Staggered rollout or hold-out, pre-registered metrics | Before-and-after on all teams | Early adopters are stronger teams |
Two rules sit across the whole table. First, report every metric per team and as a comparison between groups, never per individual. Second, publish the perception gap: what developers estimated next to what the delivery data showed. It is the fastest way to calibrate leadership expectations, and developers tend to find it more interesting than threatening.
Governance for European enterprises
In the EU, measuring developer productivity touches labour law, data protection and, from late 2027, AI regulation.
Works Constitution Act (Germany). Under section 87(1) no. 6 BetrVG, the works council has a co-determination right over the introduction and use of technical systems designed to monitor employee behaviour or performance. German labour courts have long read "designed to" as "objectively capable of", so the question is not what you intend to do with the data but what the system could do. AI-assistant admin telemetry, Git analytics, IDE plug-ins and engineering intelligence platforms almost always qualify. The practical consequence is a works agreement (Betriebsvereinbarung) fixing purpose, data, aggregation level, retention and access, and excluding individual performance evaluation. Austria's Labour Constitution Act has comparable consent rules for control systems. Plan four to eight weeks for this, and involve the works council before the pilot, not after the dashboard exists.
GDPR. Telemetry tied to a developer's account is personal data. You need a lawful basis, purpose limitation and data minimisation. In Germany, employee data processing runs through section 26 BDSG and, very often, a works agreement, which Article 88 GDPR allows as a more specific rule if it meets that article's safeguards. Large-scale systematic monitoring of employees is a common trigger for a data protection impact assessment under Article 35. Team-level aggregation, pseudonymised identifiers and short retention make all of this much simpler.
EU AI Act. Annex III, point 4(b), lists as high-risk AI systems intended to monitor and evaluate the performance and behaviour of persons in work-related relationships, or to make decisions affecting promotion or termination. A coding assistant is not such a system. An AI-driven analytics tool that scores individual developers' productivity could be. Annex III obligations were deferred to 2 December 2027 by Regulation (EU) 2026/1744, so nothing bites yet. But if you buy an "engineering intelligence" platform in 2027, check what it does at individual level: Article 26(7) will then require employers to inform workers' representatives and affected workers before using such a system. AI literacy under Article 4 has applied since February 2025.
The common thread is callout ⑥: measure teams, not people. If your operating model for AI is still taking shape, our piece on the AI operating model: CoE, federated or platform team covers who should own this measurement.
A pragmatic adoption path
- Weeks 1–2: separate the dashboards. Move vendor telemetry onto an adoption dashboard and remove "hours saved" and acceptance rate from any productivity reporting. Agree in writing which question each layer answers.
- Weeks 2–8: baseline and works agreement. Compute the five DORA metrics per team from your pipelines, plus review time and PR size. Run the first SPACE-style survey, including a perceived-speed question. In parallel, agree the measurement design with the works council and data protection officer: team-level aggregation, minimum group size, purpose and retention.
- Weeks 8–20: staggered rollout. For the next tool change, such as the move from assistants to agents, randomise teams into three waves. Pre-register the metrics and the decision rule. Compare enabled and not-yet-enabled teams at each wave boundary. Our guide to securing AI coding agents in the SDLC covers the guardrails each wave needs before agents can open pull requests.
- Week 20: fix the moved bottleneck. Expect review to be the constraint. Introduce PR size limits for AI-assisted changes, automate routine checks, and measure review load as a first-class metric. Track junior onboarding and skills explicitly.
- Quarterly: report the stack, not a number. One page: adoption, delivery trend by group, the experience survey with its perception gap, and one or two business outcomes. Decide to scale, adjust or stop against the rule from step 3.
The verdict
The honest answer to "how much more productive has AI made our developers?" is that nobody can tell you from the outside, and most internal dashboards cannot either. The published evidence runs from 19% slower to 55.8% faster, and the newest numbers are the least certain. Anyone quoting a single figure with confidence is selling something.
Stop reporting adoption as productivity. Measure four layers, with DORA in the middle and business outcomes on top. Treat developer self-report as an experience signal and publish the gap between it and the delivery data. Answer the causal question with a staggered rollout, which costs almost nothing when you are rolling out anyway. And in Europe, build team-level aggregation into the design from the first day. That is both what the law expects and what makes the numbers trustworthy.
AI probably does make many of your developers faster at writing code in late 2026. Whether it makes your organisation faster at delivering value is a separate, answerable question, and it is the one your budget depends on.
If you want help setting up the measurement stack, the staggered rollout or the works agreement, our AI advisory team runs this as a fixed-scope engagement. You leave with a baseline, an experiment design and a one-page quarterly report your board will believe.
FAQ
Does AI actually make developers more productive?
It depends on the developer, the task and how you measure. Controlled studies range from 55.8% faster completion of a greenfield JavaScript task (GitHub, 2022) to tasks taking 19% longer for experienced open-source developers in their own large repositories (METR, early 2025). Field experiments at Microsoft, Accenture and a Fortune 100 firm found 26% more completed tasks. The only answer that holds for your organisation is the one you measure yourself, with a control group.
What is the AI productivity perception gap?
It is the difference between how much faster developers believe AI makes them and what is measured. In METR's 2025 randomised trial, experienced developers believed AI had made them 20% faster while it made them 19% slower. The gap runs both ways: in GitHub's 2022 Copilot trial, participants estimated a 35% gain against a measured 55.8%. Self-reports describe experience; they do not measure speed.
Are DORA metrics enough to measure AI impact?
No, but they are the right second layer. DORA's five delivery metrics (change lead time, deployment frequency, failed deployment recovery time, change fail rate and deployment rework rate) show whether more change reaches production safely. They do not show burnout, review bottlenecks or business value, so pair them with SPACE-style experience measures and business outcomes.
Which AI coding metrics should we stop reporting?
Lines of code, suggestion acceptance rate, token consumption and AI-authored pull request counts. They measure adoption and activity, are easy to inflate and reward large changes: Faros AI found pull requests 154% larger and review time 91% longer on high-adoption teams. Keep them on an adoption dashboard and never rank individuals by them.
Do we need works council approval to measure AI developer productivity in Germany?
Almost certainly, if you collect telemetry. Section 87(1) no. 6 of the Works Constitution Act (BetrVG) gives the works council a co-determination right over technical systems that can monitor employee behaviour or performance, and German labour courts read this broadly. AI-tool telemetry, Git analytics and IDE plug-ins usually qualify. The standard route is a works agreement that limits analysis to team level, fixes purpose and retention, and excludes individual performance evaluation. GDPR and section 26 BDSG apply in parallel.
How long should an AI productivity pilot run before we decide?
At least one full quarter, after a baseline of four to eight weeks. Delivery metrics are noisy, developers need time to learn the tools, and early weeks overstate novelty effects. A staggered rollout, with the not-yet-enabled teams as the control group, gives a credible comparison within 12 to 16 weeks without taking a tool away from anyone.
Sources
All sources checked on 15 November 2026. Each study reports its effect in its own metric; the chart data file lists the metric next to every number.
Tier A: primary studies, standards and regulation
- Becker, Rush, Barnes, Rein (METR), "Measuring the Impact of Early-2025 AI on Experienced Open-Source Developer Productivity", arXiv:2507.09089: https://arxiv.org/abs/2507.09089
- METR, study announcement and summary (10 Jul 2025): https://metr.org/blog/2025-07-10-early-2025-ai-experienced-os-dev-study/
- METR, "We are Changing our Developer Productivity Experiment Design" (24 Feb 2026): https://metr.org/blog/2026-02-24-uplift-update/
- Peng, Kalliamvakou, Cihon, Demirer, "The Impact of AI on Developer Productivity: Evidence from GitHub Copilot", arXiv:2302.06590: https://arxiv.org/abs/2302.06590
- Paradis et al., "How much does AI impact development speed? An enterprise-based randomized controlled trial", arXiv:2410.12944: https://arxiv.org/abs/2410.12944
- Cui, Demirer, Jaffe, Musolff, Peng, Salz, "The Effects of Generative AI on High-Skilled Work: Evidence from Three Field Experiments with Software Developers" (Feb 2025): https://economics.mit.edu/sites/default/files/inline-files/draft_copilot_experiments.pdf
- DORA, software delivery performance metrics: https://dora.dev/guides/dora-metrics/
- Forsgren, Storey, Maddila, Zimmermann, Houck, Butler, "The SPACE of Developer Productivity", ACM Queue 19(1), 2021: https://www.microsoft.com/en-us/research/publication/the-space-of-developer-productivity-theres-more-to-it-than-you-think/
- Betriebsverfassungsgesetz, section 87: https://www.gesetze-im-internet.de/betrvg/__87.html
- Regulation (EU) 2024/1689 (AI Act), Annex III and Articles 4 and 26: https://eur-lex.europa.eu/eli/reg/2024/1689/oj/eng
- Regulation (EU) 2016/679 (GDPR), Articles 35 and 88: https://eur-lex.europa.eu/eli/reg/2016/679/oj/eng
Tier B: research and large surveys
- Google, "How are developers using AI? Inside Google's 2025 DORA report" (23 Sep 2025): https://blog.google/innovation-and-ai/technology/developers-tools/dora-report-2025/
- Google Cloud, "Introducing DORA's inaugural AI Capabilities Model" (23 Sep 2025): https://cloud.google.com/blog/products/ai-machine-learning/introducing-doras-inaugural-ai-capabilities-model
- Google Cloud, "Announcing the 2024 DORA report": https://cloud.google.com/blog/products/devops-sre/announcing-the-2024-dora-report
- Anthropic, "How AI assistance impacts the formation of coding skills" (29 Jan 2026): https://www.anthropic.com/research/AI-assistance-coding-skills
- Stack Overflow Developer Survey 2025, AI section: https://survey.stackoverflow.co/2025/ai
- Stack Overflow Developer Survey 2026, AI section: https://survey.stackoverflow.co/2026/ai
Tier C: vendor and directional
- Faros AI, "The AI Productivity Paradox" (23 Jul 2025): https://www.faros.ai/blog/ai-software-engineering
- Atlassian, "State of Developer Experience 2025" (9 Jul 2025): https://www.atlassian.com/blog/developer/developer-experience-report-2025
- GitClear, "AI Copilot Code Quality: 2025 research": https://www.gitclear.com/ai_assistant_code_quality_2025_research
Topics