CISO Board Metrics: The Security Dashboard Boards Understand
A three-tier CISO board dashboard: risk, outcome and operational metrics with owners and thresholds, mapped to NIS2 and DORA. Free xlsx template included.
Since 6 December 2025, the management of every German company in NIS2 scope has carried a duty personally. Section 38 of the revised BSI Act (BSIG) requires the Geschäftsleitung to implement the cybersecurity risk-management measures and to monitor that implementation. It makes them liable to the company for culpable breaches and requires them to attend training regularly. Banks and insurers have had the equivalent since 17 January 2025, when DORA made the management body bear "the ultimate responsibility" for ICT risk. Almost a year on, the effect is visible in board packs: directors no longer ask whether security is "fine". They ask what they are signing off, and how they would know if it went wrong.
Most CISOs answer with the dashboard they already have: vulnerability counts, phishing click rates, blocked attacks, a traffic light per ISO domain. Boards look at it, nod, and learn nothing they can act on. This article is for the CISOs who have to fix that, and for the board members, CFOs and risk officers on the other side of the table. It sets out a three-tier metric hierarchy, nine metrics with named owners, sample charts, and an editable xlsx template you can adapt this quarter.
TL;DR / Key takeaways
- Three tiers, strictly separated: risk metrics go to the board, outcome metrics explain movements in them, and operational measures stay with management. Most bad dashboards mix all three on one page.
- Three board metrics are enough: loss exposure against risk appetite in euros, tested recovery time of critical services against tolerance, and the status of regulatory obligations. Each ends in a decision: accept, fund, transfer or avoid.
- Every metric has one owner and a threshold derived from the risk appetite the board approved. Without a threshold, a number is decoration.
- NIS2 makes this evidence, not nice-to-have: Article 20 asks management to approve and oversee, Article 21(2)(f) asks for procedures that assess effectiveness, and section 38 BSIG attaches liability in Germany.
- Free template: the xlsx workbook below holds the metric catalogue, data entry and a one-page board view. All values in it are illustrative.

Download: Editable draw.io file · Open in diagrams.net · Chart data (CSV)
Template: Board dashboard template (xlsx, English) · Vorlage (xlsx, Deutsch)
Why boards are asking now
Three things changed between 2024 and late 2026.
The law named the people. NIS2 Article 20(1) requires Member States to ensure that the management bodies of essential and important entities approve the cybersecurity risk-management measures, oversee their implementation, and can be held liable for infringements of Article 21. Article 20(2) requires members of those bodies to follow training. Germany implemented this in section 38 BSIG through the NIS2 Implementation Act (BGBl. 2025 I Nr. 301, promulgated on 5 December 2025). For essential entities, Article 32(5)(b) goes further: as a last resort, authorities can ask for a temporary ban on a person exercising managerial responsibilities at CEO or legal-representative level. For financial entities, DORA Article 5(2) says the management body must "define, approve, oversee and be responsible for" the ICT risk framework.
Oversight now needs evidence. Approving measures you cannot measure is approval in name only. Article 21(2)(f) of NIS2 lists "policies and procedures to assess the effectiveness of cybersecurity risk-management measures" as a mandatory measure in its own right. A supervisor or a court reviewing a management decision after a breach will ask what the board saw and what it did with it. Minutes that say "the CISO presented the security update" will not help much. A quarterly page showing exposure against appetite, the decision taken and the owner will.
The losses are big enough for board attention. IBM and the Ponemon Institute put the global average cost of a data breach at USD 4.99 million in the 2026 Cost of a Data Breach Report. IBM calls that a record high and 12% more than the previous year. Verizon's 2026 Data Breach Investigations Report, covering incidents from November 2024 to October 2025, found that exploited software vulnerabilities were the most common way in, at 31% of breaches, ahead of stolen credentials. It also found ransomware in 48% of breaches. Those two findings drive the choice of metrics ④ and ⑦ below.
Regulators are moving the same way. In June 2026, CISA replaced its known-exploited-vulnerabilities directive for US federal agencies with BOD 26-04, Prioritizing Security Updates Based on Risk. It ranks every vulnerability on every asset by four factors: whether the asset is publicly exposed, presence in the KEV catalogue, whether exploitation can be automated, and technical impact. That is the logic of an outcome metric. It rewards fixing what is exposed and exploited, not fixing many things.
What makes a metric a board metric
Before the hierarchy, a definition. We use five tests, and a number has to pass all of them to reach the board page.
- It maps to a decision. The board can accept the risk, fund a reduction, transfer it (insurance, contract) or avoid it (stop the activity). If no movement in the number would change any of those, it does not belong on the page.
- It has a threshold set from risk appetite. Green, amber and red are derived from what the board said it would tolerate, not from what the security team thinks looks good.
- It has one owner. A named executive answers for it. Usually that is not the CISO; the CISO measures and advises.
- It shows a trend. One quarter tells you where you are; four quarters tell you whether the investment works.
- A non-specialist can explain it back. If a supervisory board member cannot restate the metric in a sentence, rewrite it.
NIST's measurement guide, SP 800-55 Volume 1 (December 2024), frames the same idea for selecting and prioritising measures. NIST CSF 2.0 (February 2024) added a Govern function next to Identify, Protect, Detect, Respond and Recover, and put risk strategy, roles and oversight in it. Our hierarchy is an opinionated way to turn both into one page.
| Typical dashboard number | Why it fails at board level | What to show instead |
|---|---|---|
| "1.2 million attacks blocked" | Measures adversary volume and tooling, not your risk; it goes up when you buy a better filter | Loss exposure of the top scenarios against appetite (①) |
| "4,000 patches deployed" | Activity, no denominator, no prioritisation | Exploited vulnerabilities on internet-facing assets fixed within SLA (④) |
| "98% of staff completed awareness training" | Compliance, weak link to outcomes | Users on phishing-resistant MFA (⑤) |
| "ISO 27001 domains: 11 green, 3 amber" | Control maturity, not exposure; impossible to prioritise | Regulatory and accountability status with overdue findings (③) |
| "Backups: 99.9% job success" | A successful job is not a successful restore | Tested recovery time of critical services against tolerance (②, ⑦) |
| "Mean time to detect: 4 minutes" | Usually measured on alerts, not incidents; easy to game | Median time to contain significant incidents (⑥) |
The hierarchy, metric by metric
The numbers match the callouts in the figure. For each metric we give the definition, the owner, an example threshold and the trap we see most often. The thresholds are examples. Yours come from your risk appetite.
① Cyber loss exposure against risk appetite
What it shows. For the top five cyber scenarios, the modelled annual loss exposure in euros, next to the appetite the board approved for each. Typical scenarios for a European mid-cap: ransomware stopping ERP and production; outage of a critical SaaS or cloud supplier; a customer-data breach under GDPR; payment fraud via email or deepfake; insider theft of intellectual property.
How to build it. Use a structured quantification model. Open FAIR, published by The Open Group, expresses risk in financial terms through the frequency and magnitude of loss events. Calibrate with your own incident history, insurance data and structured expert estimates. Show a range, not a false-precision point value.
Owner. CISO and CRO jointly: the CISO owns the model, the CRO owns how it fits enterprise risk.
Example threshold. Green when all five scenarios are within appetite; amber at four; red below that.
The trap. Precision theatre. A figure of EUR 18.27m implies knowledge nobody has. Round, show the range, and say what would move it.
② Critical-service recovery against tolerance
What it shows. For each tier-1 business service, the time to restore measured in the most recent real test, next to the impact tolerance the board set. "ERP back within 24 hours" is a board statement. "Restore test took 36 hours" is a fact. The gap is the decision.
Owner. COO and CIO. The business owns the tolerance; IT owns the recovery.
Example threshold. Green when every tier-1 service is within tolerance; amber when one misses; red when more miss or a test is overdue.
The trap. Reporting backup job success rates. DBIR's 48% ransomware share is why we insist on tested restore time, from immutable copies, under realistic conditions. Our ransomware-resilient backup architecture on Azure covers the isolated recovery environment that makes such a test credible.
③ Regulatory and accountability status
What it shows. A compact status of the obligations that bind the management body: NIS2 registration and reporting readiness, open findings from auditors and supervisors with due dates, the date the board last approved the risk-management measures, and management training completed.
Owner. General Counsel or Head of Compliance, with the CISO.
Example threshold. Green with zero overdue findings and a current approval; amber with up to two overdue; red beyond that or if approval has lapsed.
The trap. Turning this into a compliance heat map with forty cells. The board needs three facts: are we registered and able to report, is anything overdue, and have we done what the law asks of us personally. Our article on NIS2 management liability in Germany lists the evidence a supervisor will want.
④ Exposure: exploited vulnerabilities on internet-facing assets fixed within SLA
What it shows. Of the vulnerabilities listed in CISA's Known Exploited Vulnerabilities catalogue (or your equivalent threat-informed list) that were found on internet-facing assets, the share fixed or mitigated within the agreed time.
Why this one. It is the outcome that drives metric ①. Exploitation was the leading breach entry point in DBIR 2026, and BOD 26-04 now prioritises on exactly these factors: exposure, known exploitation, automatability and impact. A rising number here should show up as falling exposure in the ransomware scenario. Our guide to continuous threat exposure management shows how to build the pipeline behind it.
Owner. CIO or Head of Infrastructure: the people who can actually patch.
Example threshold. Green at 95% or more; amber from 85%; red below.
The trap. A denominator that shrinks. If the asset inventory misses internet-facing systems, the metric looks great and means nothing. Report inventory coverage with it.
⑤ Identity: phishing-resistant MFA coverage
What it shows. The share of users, and separately of privileged accounts, whose sign-in enforces phishing-resistant authentication: FIDO2 security keys, passkeys or certificate-based authentication. NIS2 Article 21(2)(j) names multi-factor or continuous authentication as a measure.
Owner. Head of Identity and Access Management.
Example threshold. Green with 100% of admins and at least 90% of users; amber with all admins but fewer users; red if any admin is not covered.
The trap. Counting "MFA enabled" when push notifications or one-time codes can still be relayed by an adversary-in-the-middle proxy. Our ITDR guide to token theft and AiTM phishing explains why the method matters more than the checkbox.
⑥ Detect and contain: time to contain significant incidents
What it shows. The median time from detection to containment for incidents classified as significant. Use the same threshold you use for NIS2 incident reporting, so the board sees the same events the regulator would.
Owner. SOC lead or Head of Security Operations.
Example threshold. Green with a median of eight hours or less; amber up to 24 hours; red beyond.
The trap. Reporting mean time to detect on alerts. It is easy to drive down by tuning, and it says nothing about whether you stopped anything. Containment of real incidents is harder to fake.
⑦ Recoverability: tier-1 systems with tested, immutable backups
What it shows. The share of systems supporting tier-1 services that have an immutable or logically isolated backup copy and a successful restore test in the last 90 days.
Owner. Head of IT Operations.
Example threshold. Green at 100%; amber from 90%; red below.
The trap. Testing the restore of a single virtual machine and calling the service recoverable. The test that counts restores the whole dependency chain: identity, network, data, application.
⑧ Third parties: critical suppliers assessed, with an exit plan
What it shows. The share of critical ICT suppliers with a current security assessment and a documented exit or substitution plan. NIS2 Article 21(2)(d) requires supply-chain security; DORA Article 28 requires exit strategies for ICT services supporting critical or important functions.
Owner. Chief Procurement Officer with the CISO.
Example threshold. Green at 100%; amber from 80%; red below.
The trap. Questionnaires as assessment. A 300-question spreadsheet returned by the supplier's sales team tells you little. Concentration matters more: how many tier-1 services depend on one provider? Our DORA cloud exit plan runbook shows what a usable exit plan contains.
⑨ The operational layer: what stays below the line
Patch counts, scanner coverage, EDR agent health, alert volumes, phishing simulation click rates, training completion, firewall change counts, open findings by severity. A security function runs on hundreds of such measures, and it should. They feed the outcome tier and tell team leads where to act this week.
They do not go to the board alone. The rule we apply: an operational number may appear on the board page only as an explanation for a change in a risk or outcome metric, in one sentence, with the owner's name next to it. "Exposure rose because scanner coverage of the newly acquired plant dropped to 60%; the CIO expects full coverage by February" is useful. A chart of scanner coverage by business unit is not.
The sample dashboard: what the numbers say
The three charts below show what the board page looks like for a fictional European manufacturer, "Example AG". All values are illustrative. We wrote them to demonstrate the format; they are not survey, benchmark or client data. The same values are in the downloadable workbook and the CSV.
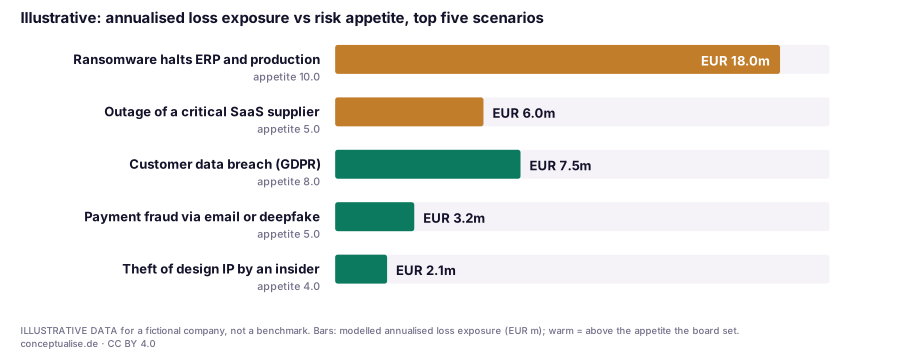
Reading chart 1. Two scenarios exceed the appetite the board approved: ransomware stopping ERP and production (EUR 18m modelled against an appetite of EUR 10m) and the outage of a critical SaaS supplier (EUR 6m against 5m). Metric ① is therefore three out of five within appetite: red. The board's job is not to admire the bars. It is to pick a response for each warm bar. Fund a reduction? Transfer part of it through cyber insurance? Or accept it, minuted, with a review date? For readability the chart shows point estimates; a real board page adds the range behind each bar.
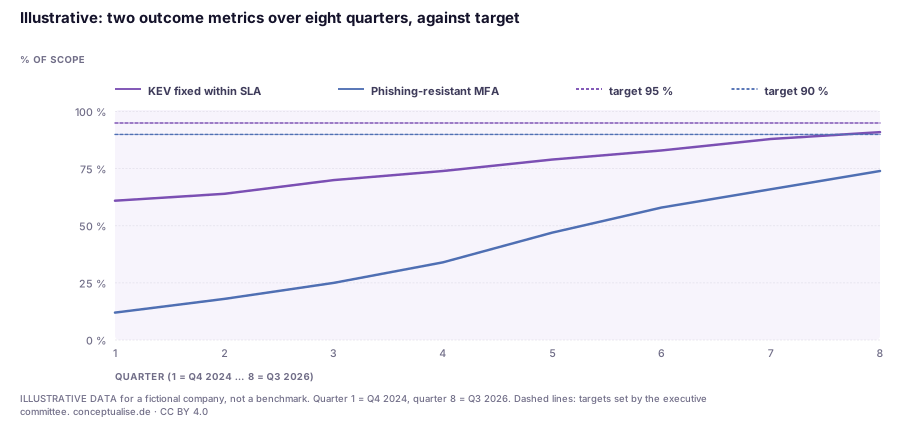
Reading chart 2. Exploited vulnerabilities on internet-facing assets fixed within SLA rose from 61% to 91% over eight quarters. Phishing-resistant MFA coverage rose from 12% to 74%. Both are still below target, so both are amber. This is the chart that answers "is the money working?". If the ransomware exposure in chart 1 is not falling while these lines climb, either the model or the metrics are wrong, and someone should find out which.
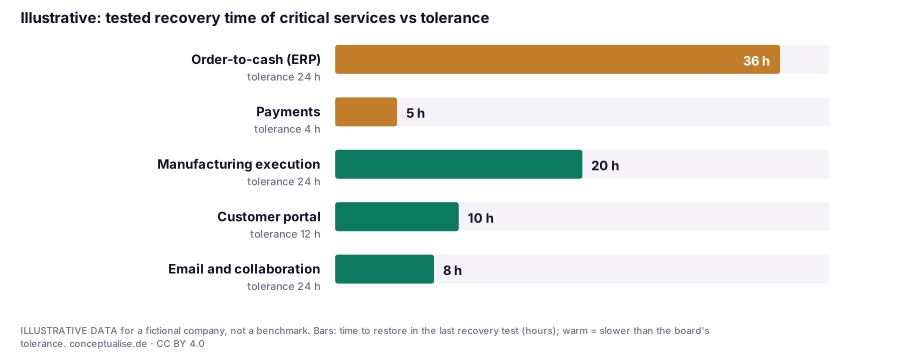
Reading chart 3. Order-to-cash took 36 hours to restore in the last test against a tolerance of 24; payments took five hours against four. Three of five services are within tolerance, so metric ② is red. The payments miss is small but matters: in many firms that tolerance comes from contractual or regulatory commitments, not from IT.
What the numbers say, taken together: Example AG is improving its controls steadily, but its two largest risks are still outside appetite. Both connect to recovery of the ERP landscape. A board that sees only charts 2 and 3 would conclude that things are going well. A board that sees chart 1 next to them sees that the next euro should go into ERP recovery, not into a broader MFA rollout. That is the point of the hierarchy.
The quarterly cycle
In a recent engagement
In a recent engagement with a DACH industrial group, the CISO's quarterly board report ran to dozens of slides. It covered every ISO 27001 domain, every tool in the stack and a world map of blocked attacks. The supervisory board had asked twice for "something we can actually steer by". After the NIS2 Implementation Act took effect, the chair asked a sharper question: what exactly were they approving, and how would they know if it stopped working?
We rebuilt the report in three workshops. The first agreed five loss scenarios with the CFO and the CRO, not with the security team alone, and set appetites the CFO could defend. The second assigned an owner to each outcome metric. That was the hard part, because several of the owners had never been asked to answer for a security number before. The third moved every operational measure into an appendix the board never sees, which caused more debate inside the security team than anywhere else.
The first one-page report showed two scenarios outside appetite. Both were driven by recovery time, not by prevention. The board approved funding for an isolated recovery environment in the same meeting and minuted a review date. Nothing in the underlying data had changed. Only the structure had.
Board-page checklist
Use this before every quarterly submission. It is the screenshot-able part.
- The page fits on one screen or one printed page.
- No more than three risk metrics and six outcome metrics.
- Every metric has a named owner, a written definition and a data source in the catalogue.
- Every threshold traces back to a board-approved risk appetite or tolerance.
- Every metric shows at least four quarters of trend, or says why not.
- Every red or amber metric comes with a proposed decision: accept, fund, transfer or avoid.
- Operational measures appear only as one-sentence explanations, never as charts.
- Loss figures are rounded and shown with a range or confidence statement.
- The page states the date the board last approved the risk-management measures and when management training was last completed.
- The minutes record the decision, the owner and the review date for every red item.
| Decision on a red metric | When it fits | What the minutes need |
|---|---|---|
| Accept | Cost of reduction exceeds expected benefit; within overall risk capacity | Explicit acceptance, rationale, review date |
| Fund | A credible plan exists to bring exposure inside appetite | Budget, owner, target quarter, metric expected to move |
| Transfer | Residual risk is insurable or contractually shiftable | Policy or contract reference, retained portion |
| Avoid | Activity creates exposure out of proportion to its value | What stops, by when, who confirms |
Governance for European enterprises
Only regimes that genuinely apply to board security reporting are listed here.
NIS2 and the German NIS2 Implementation Act. Article 20 makes management bodies approve the risk-management measures, oversee them and be liable; Article 21(2) lists the measures, including (f) effectiveness assessment. Member States must set maximum fines of at least EUR 10 million or 2% of worldwide annual turnover, whichever is higher, for essential entities, and at least EUR 7 million or 1.4% for important entities (Article 34(4) and (5)). In Germany, section 38 BSIG requires management to implement and monitor the measures under section 30, makes them liable to the entity for culpably caused damage under company law, and requires regular training. Metric ③ and the training line in the template exist for this.
DORA (financial entities). Article 5 makes the management body bear ultimate responsibility for ICT risk and expects members to keep their knowledge current. Metrics ②, ⑦ and ⑧ map to DORA's requirements on response and recovery, backup and restoration, and third-party exit strategies. If you are a bank or insurer, use DORA's terminology on the board page; your supervisor will.
US-listed groups. Since the SEC's 2023 cybersecurity disclosure rules, Regulation S-K Item 106 requires the annual report to describe the board's oversight of cybersecurity risk and management's role and expertise. A European group with a US listing gets a second reason to keep a clean oversight trail.
What does not belong here. The Cyber Resilience Act is a product obligation for manufacturers; if you are one, add your PSIRT readiness to metric ③, covering the Article 14 reporting duty that has applied since 11 September 2026. Otherwise, leave it off the board page.
Pragmatic adoption path
- Weeks 1–2: agree the scenarios and appetite. CISO, CRO and CFO select the top five loss scenarios and propose an appetite for each. The board approves them. Without this step nothing downstream has a threshold.
- Weeks 3–4: write the metric catalogue. Definition, numerator and denominator, data source, owner, cadence and thresholds for each metric. The template's catalogue sheet is the starting point. Get each owner's signature.
- Weeks 5–6: wire the data. Pull outcome metrics automatically from the scanner, identity provider, SIEM, backup platform and supplier register. Manual spreadsheets drift within two quarters.
- Weeks 7–8: run a dry board session. Present the one-page view to the CFO and the audit committee chair first. If they cannot explain it back, simplify it.
- Quarter 2 onwards: decide, minute, review. Every red metric gets a decision and a review date in the minutes. Revisit scenarios and appetite annually, or after a major incident or acquisition.
The verdict
A board security dashboard fails when it reports what the security team does. It works when it reports what the company risks, against what the board said it would accept, with someone named for every number. The hierarchy is the whole trick: risk metrics for decisions, outcome metrics for explanation, operational measures for running the function. NIS2 and DORA did not invent this. They made it the evidence a management body needs when someone asks, after the fact, what it knew and what it did. Start with the scenarios and the appetite. The charts are the easy part.
If you want a second pair of senior eyes on your board reporting, from loss scenarios and appetite to the metric catalogue and the data pipeline behind it, our Zero Trust and cybersecurity practice builds and pressure-tests exactly this with European management teams. Start with the free xlsx template.
FAQ
What security metrics should a CISO report to the board?
Few, and expressed as risk. We recommend three board-level metrics: modelled loss exposure for the top cyber scenarios against the risk appetite the board approved, tested recovery time of critical services against tolerance, and the status of regulatory obligations and findings. Five outcome metrics, each with an owner, explain movements in those three. Operational measures stay with management.
How many metrics belong on a board security dashboard?
Our working limit is one page: three risk metrics and five to six outcome metrics, each with a threshold, a trend and a named owner. If a board member cannot explain the page back to you in two minutes, it has too many numbers on it.
Why are patch counts and blocked attacks bad board metrics?
They measure activity, not risk. A board cannot decide anything from 1.2 million blocked emails or 4,000 patches deployed. The useful question is whether exploited vulnerabilities on internet-facing assets are fixed within the agreed time, which shows whether exposure is under control.
Does NIS2 require a security dashboard for the board?
Not by name. NIS2 Article 20 requires management bodies to approve the cybersecurity risk-management measures and oversee their implementation, and Article 21(2)(f) requires procedures to assess their effectiveness. In Germany, section 38 BSIG makes management implement and monitor the measures and be liable for culpable breaches. A dashboard is the most practical evidence of that oversight.
How do we express cyber risk in euros without inventing numbers?
Use a structured model such as Open FAIR, which expresses risk in financial terms, and be honest about ranges. Estimate how often a scenario could cause loss and how large the loss would be, calibrated with internal incident data, insurance figures and expert judgement. Present the result as an estimate with a range, not a precise figure.
Is the xlsx dashboard template free to use?
Yes. The English and German workbooks are published under CC BY 4.0. They contain a metric catalogue with owners and thresholds, quarterly data entry, risk scenarios, recovery tests and a one-page board view that calculates status and trend. All sample values are illustrative and describe a fictional company.
Sources
Checked on 15 November 2026. This article is not legal advice. All chart values are illustrative and were written by us.
Tier A: primary and regulatory
- Directive (EU) 2022/2555 (NIS2), EUR-Lex: Art. 20, 21(2), 32(5)–(6), 34(4)–(5)
- BSI Act (BSIG) § 38, gesetze-im-internet.de: implementation, monitoring and training duties of management
- Act implementing the NIS-2 Directive, BGBl. 2025 I Nr. 301 (5 December 2025)
- Regulation (EU) 2022/2554 (DORA), EUR-Lex: Art. 5, 11, 12, 28
- CISA BOD 26-04: Prioritizing Security Updates Based on Risk (10 June 2026)
- CISA BOD 22-01 (revoked, superseded by BOD 26-04)
- NIST SP 800-55 Vol. 1, Measurement Guide for Information Security (December 2024)
- NIST Cybersecurity Framework 2.0, CSWP 29 (26 February 2024)
- SEC press release 2023-139: cybersecurity risk management, strategy, governance and incident disclosure rules (26 July 2023)
Tier B: research and analysis
- IBM and Ponemon Institute: Cost of a Data Breach Report 2026
- Verizon: 2026 Data Breach Investigations Report
Tier C: vendor and directional
- FAIR Institute: What is FAIR? (Open FAIR is a standard of The Open Group)
Topics